"Show me a trader with a good trading records, and I'll show you a good trader" (dr Alexander Elder)Earlier this year I read up quite a number of trading books. I came across Alexander Elder's Sell and Sell Short which in my opinion is a really good trading book. Like most well-known trading book, Sell and Sell Short elaborates the importance of the 3M (Mind, Method, Money). However, dr Elder went on to emphasize the essence of Trading Diary, or I call it Trading Journal. Some people refer it as Investment Tracker Spreadsheet, Tracking Spreadsheet or Stock Tracking Spreadsheet Template. They all mean the same.
The idea of having this is clear. You will have to monitor you progress in stock trading. Have you been making money or wasting time and money? So if you are trading stocks now and do not have any tools to track the performance (papers, excel templates, online service portfolio, etc), you better make one! Most stock trading software or even your broker account will have this sort of monitoring platforms. However, these may not meet your needs.
Here I am sharing my simple template which is fairly sufficient for my daily monitoring of my stocks. Please note that this template is only for educational purpose, so please use it for your own (do not sell it!). I do not protect the file with password and you are free to tweak it as you wish. What you need could be more than what the template can provide.
The link to download the file is here. While the simple instruction is below. As I am now quite actively trading in emerging markets, I am using Indonesia stocks for examples (all numbers used are dummy numbers - not my trading performance).
First tab - Stock Tracking
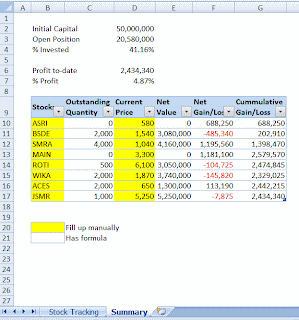
Second Tab - Summary
- There are two tabs: Stock Tracking and Summary. Stock Tracking is where you key in manually every trades (Buy, Sell, Dividend) you make. Summary is to see per-ticker performance.
- For those highlighted in YELLOW, you have to fill up manually, while those not highlighted are already containing formula.
- Ok, first tab. First fill you what is you initial investment you make at the start of the year (eg. IDR 50,000,000 - see cell D5). Also, type what's the commission percentages for Buy and Sell (cells D6 and D7).
- Then fill up the table (make use "TAB" to move the cursor the the right).
- Stocks - what stocks you buy/sell
- Position - are you buying or selling. Or are you getting dividend (if dividend, please fill up the rest manually)
- Date Buy/Sell - dates of transactions
- Price per share
- Quantity of shares
- Ok, second tab. Fill up what are the unique stocks you have from tab Stock Tracking. This tab is to summarize the stock performance. For "Current Price", please fill up today price (you can get it from Yahoo Finance).
- Also, here, there is formula to see how much is the percentage of your profit over your initial investment.
This is a simple stock tracking spreadsheet using Microsoft Excel. This works for me and sufficient enough to meet my needs. Feel free to tweak this or even make a new one based on the concept and share with me.
Hope this investment tracking is beneficial for everyone.


No comments:
Post a Comment